Create an Azure Website for your Country or Location
The main Global Azure Bootcamp Racing Game Website shows top times for all the attendees at all the locations around the globe. This lab will walk through the creation of a website to display the top lap times for your location. The website can then be deployed to Microsoft Azure App Services, allowing for attendees at that location to compete with each other and share the results on-line.
The website is developed purely in HTML5 and JavaScript, and has no dependencies on Microsoft technologies or the .NET framework. Visual Studio will be used for the development of the website, but it is possible to use other tools if you wish.
The following concepts will be covered:
· Azure Storage REST API
· Querying Azure Table Storage
· Creating an Azure Web App
· Publishing a Website to Microsoft Azure
Estimated time: 60 minutes
Exercise 1: Create the Website
In this exercise a simple website will be created, tested, and deployed to Azure. Initially the website will not contain any real functionality, but with the site deployed to the cloud, it can be modified and quickly re-deployed as required.
Visual Studio is required for the creation of this lab, with the instructions based on Visual Studio 2013. If you don’t have Visual Studio installed on your computer, Visual Studio Community 2013 can be downloaded here.
Task 1: Create a new Website Application
The lap times website will be created in Visual Studio using a web application template.
1. Start Visual Studio.
2. Create a new
project using the ASP.NET Web Application
template in the Visual C# / Web section.
Although a C# template is being used, there will be no dependency on C# or
the .NET framework.
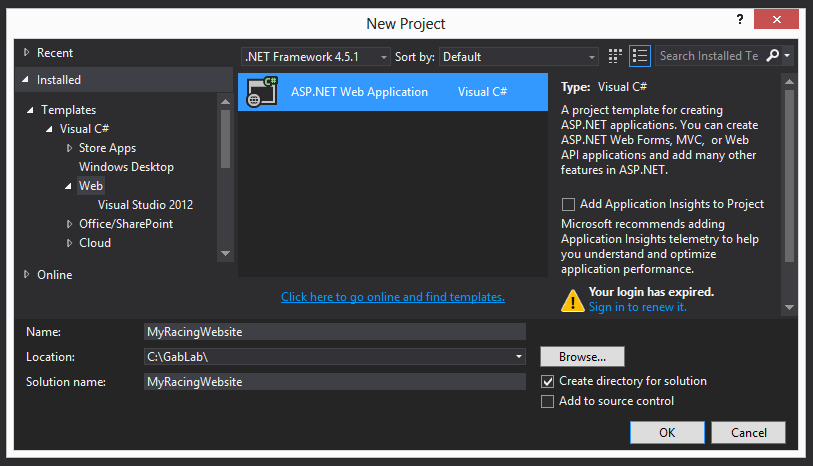
3.
In the New ASP.NET Project dialog,
select the Empty template, verify that the
Host in the cloud checkbox in the Microsoft Azure section is not checked, then
click OK.
An empty web site will be created in Visual Studio.
Task 2: Create the Index Page and Title
The index page for the website will start out with the website title, a reference to the Bootstrap CSS file, and comment placeholders for the additional steps in the lab.
Step 1: Create the Index Page and Reference the Bootstrap Stylesheet
The Bootstrap stylesheet will be used to format the user interface elements in the website.
1. Add an HTML Page to the project and name it index.html.
2. Choose a title
for your website, and add it to the title tag.
Feel free to be creative here.
|
<!DOCTYPE html> <html xmlns="http://www.w3.org/1999/xhtml"> <head> <title>YOUR_WEBSITE_TITLE</title> </head> <body>
</body> </html> |
1.
Copy-paste the highlighted link to the bootstrap CSS file.
If the link is incorrect, the code won’t load.
|
<!DOCTYPE html> <html xmlns="http://www.w3.org/1999/xhtml"> <head> <title>YOUR_WEBSITE_TITLE</title> <link rel="stylesheet" href="//maxcdn.bootstrapcdn.com/bootswatch/3.3.2/cosmo/bootstrap.min.css"> </head> <body>
</body> </html> |
Step 2: Add a Style Sheet to the Website Project
There are a few styles that we need to define, for example the styles that control how the telemetry graph will be formatted. In this step a simple style sheet will be added and linked to from the index page.
1. In the web
project, add a new style sheet named racing.styles.css.
2. Copy-paste the following code into the style sheet.
|
.panel table { margin-bottom: 0; }
.table-hover tr td { cursor: pointer; }
#TelemtryGraphWrapper { width: 100%; }
#TelemtryGraphWrapper .graph { width: 100% !important; }
|
3. Switch back to index.html and add a link to the newly created stylesheet.
|
<!DOCTYPE html> <html xmlns="http://www.w3.org/1999/xhtml"> <head> <title>YOUR_WEBSITE_TITLE</title> <link rel="stylesheet" href="//maxcdn.bootstrapcdn.com/bootswatch/3.3.2/cosmo/bootstrap.min.css"> <link href="racing.styles.css" rel="stylesheet" /> </head>
|
4. Save all the files.
Step 3: Add the Page Title and ToDo Placeholders for other Lab Steps
The next step is to display the title in the page, and add the comment placeholders for the tables that will contain the lap times. If you would like to get creative with the design of the site, feel free to do so, or alternately you can focus on the functionality and customize the site later on.
1.
Add the highlighted HTML code to the page body add a header to the
website page, replacing YOUR_WEBSITE_TITLE
with the title you would like to use for your site.
Feel free to copy-paste the HTML code if you like, the class names must
match the stylesheet exactly.
2.
Add the highlighted ToDo comments for the later stages in the lab.
These will be used as placeholders for adding HTML code to render the
location and country lap data, and graphs for the telemetry data.
|
<html xmlns="http://www.w3.org/1999/xhtml"> <head> <title>YOUR_WEBSITE_TITLE</title> <link rel="stylesheet" href="//maxcdn.bootstrapcdn.com/bootswatch/3.3.2/cosmo/bootstrap.min.css"> </head> <body> <nav class="navbar navbar-default"> <div class="container-fluid"> <div class="navbar-header"> <a class="navbar-brand" href="#"> YOUR_WEBSITE_TITLE </a> </div> </div> </nav>
<!-- Todo: Add HTML code for the location lap tables -->
<!-- Todo: Add HTML code for the country lap tables -->
<!-- Todo: Add HTML code for the telemetry graphs. -->
</div>
</body> </html> |
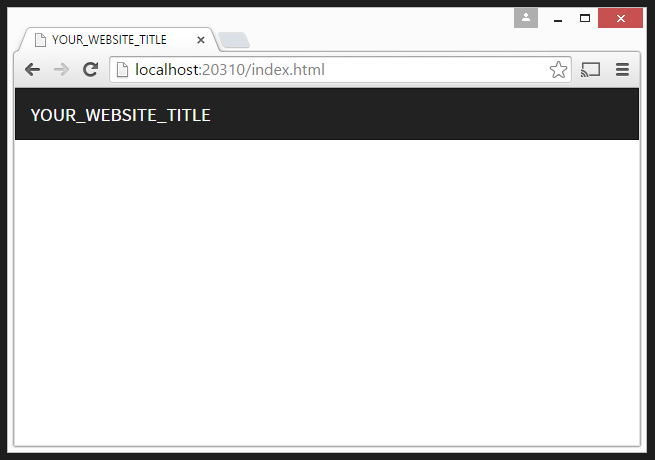
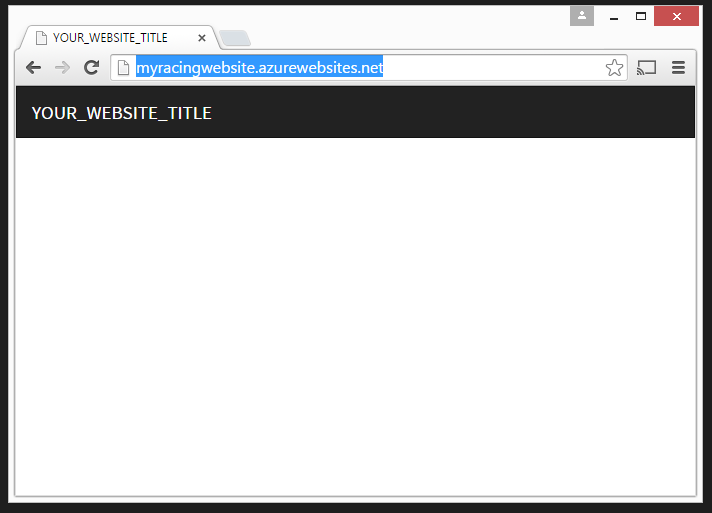
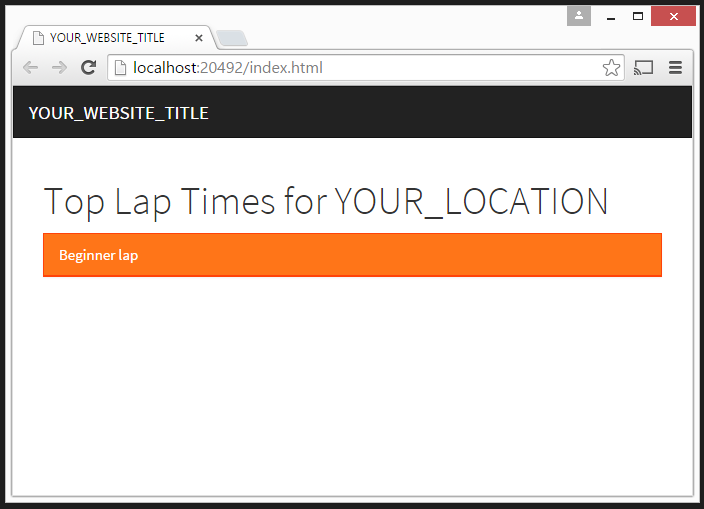
3.
In Visual Studio, press F5 to view the webpage in your browser.
You should see a page displayed similar to the following screenshot.
Task 3: Deploy the Website Prototype to Microsoft Azure
Deploying a web application to Microsoft Azure is quick and easy. Doing this early in the development of the website will allow you to modify and deploy the website rapidly, so that you always keep a working copy of the site available, and can update it frequently.
Step 1: Create a Microsoft Azure Web App
Azure Websites were recently re-branded to Azure Web Apps, the functionality is pretty much the same.
1. Sign in to the
Microsoft Azure management portal at https://portal.azure.com.
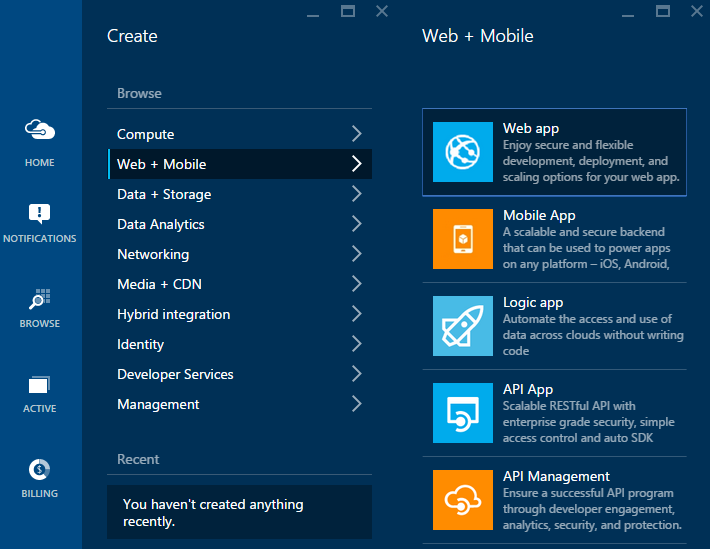
2. Click New in the
bottom-left corner, then click Web + Mobile,
then Web App.
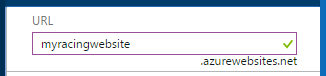
3.
In the ULR box, enter a unique name
for your website.
The name must be valid, unique, and not contain any obscene words.
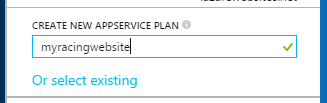
4.
In the next box, enter the same name for a new AppService
Plan.
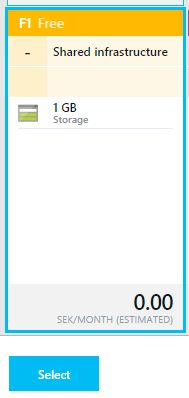
5.
Expand the Pricing Tier options and in
the Pricing Tier section, click the arrow,
then click View All, and select the F1 Free
option.
Unless you get a large number of visitors on your site, the F1 Free option
will be fine.
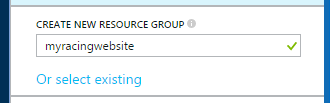
6. In the Resource Group section, enter the name you used for your website and the AppService plan.
7. In the Location section, click the arrow, and select the
location that is closest to your region.
8. Your settings should look similar to those shown below.
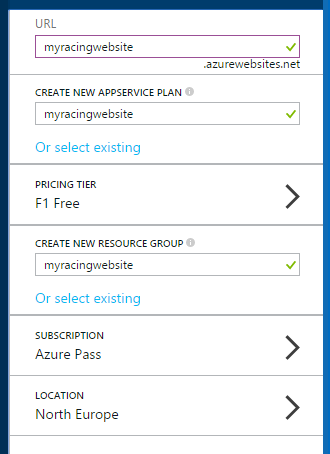
9. Click the Create button to create the WebApp.
Step 2: Deploy!
The next step is to deploy the project to the Azure Web App.
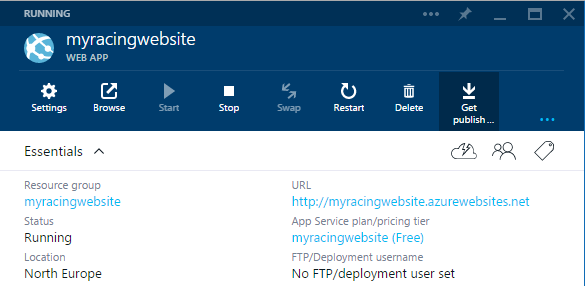
1.
In the WebApp pane, click the Get publish.. button to download the publishing
profile for the website.
The button actually says “Get publish profile”, but the text is truncated.
2. Make a note of
the folder location where the profile was saved, it will be needed later on.
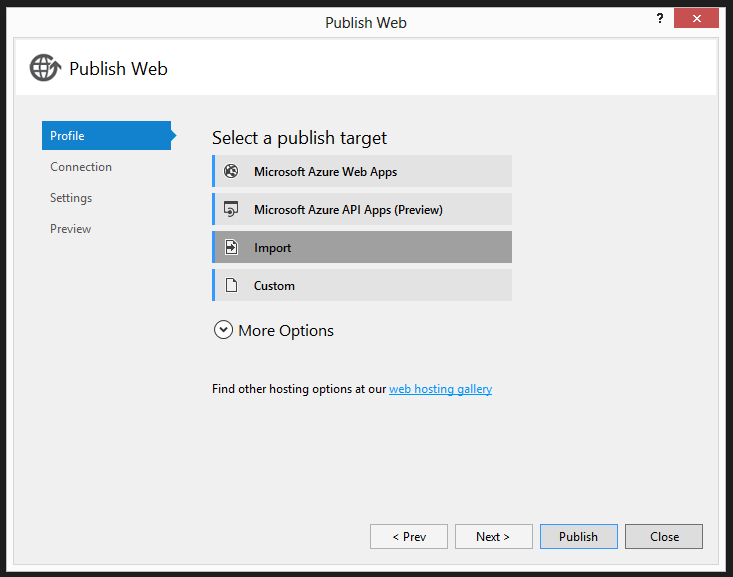
3. Switch to Visual Studio, then right-click on the web project
and select Publish.
4. Click the Import button.
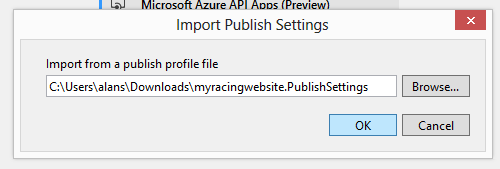
5.
Click the Browse button, then browse
to the location for the publishing profile, then click OK.
6.
Click the Publish button to publish
the site to Azure.
After a few seconds you should see the website appear in a browser window.
Note that the URL of the web site is in the azurewebsites.net domain, and
starts with the URL you selected for your website.
Exercise 2: Display the Top Lap Times for the Beginner Track for Your Location
Now that the website is up and running in Azure, we can focus on adding some functionality. In this exercise we will add the user interface HTML markup, and then JavaScript code to query Azure Storage using the REST API and render the data in the user interface. If you would like to explore the Azure Table Storage API in more there is an optional task where you can use a web browser to query the tables directly, and examine the data returned.
Task 1: Implement the Code to Display Top Lap Times for the Beginner Track
Now that we have the page created and the title in place, we can query Azure Table Storage to retrieve some lap times and display them in the page.
Step 1: Download the Racing Game Lab Files
To save time creating a lot of boiler-plate code, there are two starter files that need to be downloaded and added to the project.
1. Download the
following zip file to the folder containing your website solution file: https://gabracinglab.blob.core.windows.net/lab/RacingGameLabFiles.zip
2. Extract the contents of the Zip file to the same location.
Step 2: Add the Starting JavaScript Files
The files can now be added to the project.
1. Add the
JavaScript file named racing.data.js to the
project.
2. Examine the code
in the file.
This file contains code to create and format the URIs for table storage,
and create the data objects for the three tracks. There are ToDo placeholders
where code will be added to query Azure Table Storage and create data objects
for the track.
3. Add the
JavaScript file named racing.main.js to the
project.
4. Examine the
code.
This file contains code to format the lap times and access the table row
objects that will be used to render the lap times. Like the other file, there
are ToDo placeholders for the code that will be added in the lab to handle the
lap time data.
Step 3: Create a the User Interface Code
The next step is to add HTML markup to the user interface so that the lap time data can be displayed. To start off with only one table will be added to display the top times for the easy track. This will be expanded later to include all three tracks.
1. Open index.html and add the highlighted code to reference
the two JavaScript files.
A quick and easy way to do this is to drag the files from the Solution
Explorer to the appropriate place in the HTML page.
2.
Add the highlighted code to display a header for the lap times, and a
table to display the lap times for the beginner lap.
You may want to copy-paste this code to ensure the formatting is correct.
|
<div class="container-fluid">
<!-- Todo: Add HTML code for the location lap tables --> <h1 class="title">Top Lap Times for YOUR_LOCATION</h1> <div class="track-stats-location row"> <div class="col-md-4"> <div class="panel panel-warning"> <div class="panel-heading">Beginner lap</div> <table class="track-stats-beginner table table-striped table-hover"></table> </div> </div> </div>
<!-- Todo: Add HTML code for the country lap tables -->
<!-- Todo: Add HTML code for the telemetry graphs. -->
</div> |
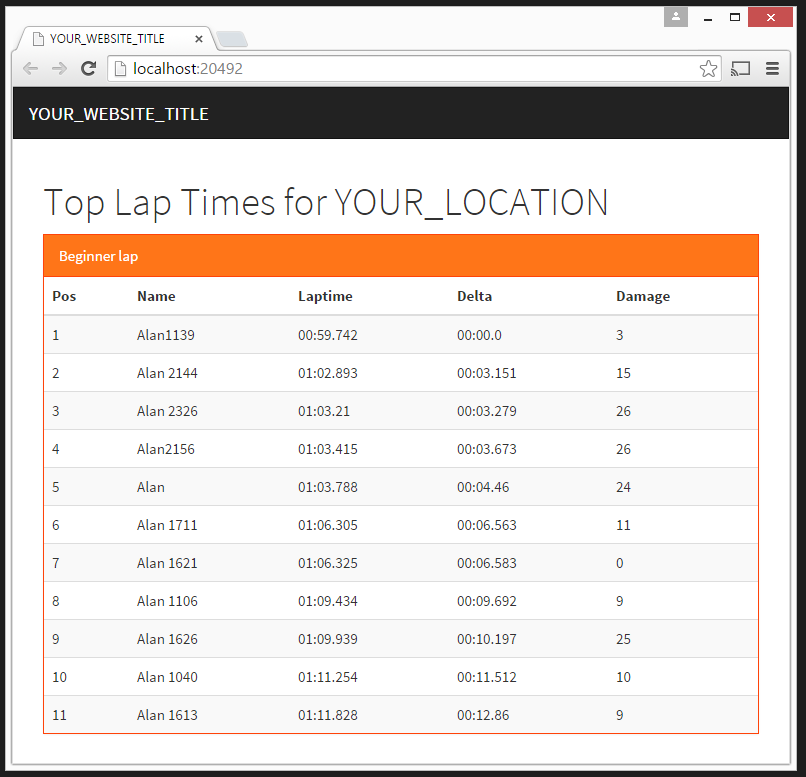
3.
Press F5 to view the page in the
browser.
You should see a page similar to the following screen-shot.
Step 4: Add JavaScript Code to Access Microsoft Azure Table Storage
With the HTML code for the lap times table complete, the next step is to add code to query Azure Table Storage and retrieve the lap time data for your location.
1. Open racing.data.js and review the file.
You will see a number of ToDo comments where you will be adding the code in
this step.
2. Add the highlighted code the get JSON data from Table Storage.
3.
Add the highlighted code to format a Table Storage URI, feel free to
copy-paste it if you like, the formatting of the URL must be exact.
This code will create a URL for accessing the data from an Azure Table
Storage table. The URL will include the base URL for the table, the shared
access signature used to allow read access, and any query parameters to select
data using the specified partition key, and the fields from the table to
select.
4.
Add, or copy-paste, code to get data from a Table Storage table.
This function will call the getTableStorageUrl function to get the
appropriate URL for the table, and then call the getJson function to query the
table using a GET request. The successCallback function will be called if the
call was successful. If there was an error calling the table it will be
displayed in the console.
5.
Add code to get data for the specific location.
This code will call the getTableStorageData function to query Azure Table
Storage for the top lap times for a specific Global Azure Bootcamp location.
Later in the lab the getTrack method can be extended to query for top lap times
for a specific country.
|
// Creates an object for retrieving data for a specified track. function getTrack(track) { return {
// ToDo: Add code to get data for the specific location getRankingLapTimesByLocation: function (successCallback, fields, locationId) { var filter = getPartitionFilter(locationId); getTableStorageData(auths.tracks[track].rankingLapTimesLocationTrack, successCallback, fields, filter); },
// ToDo: Add code to get data for the specific country
// ToDo: Add code to get the telemetry data for a specific lap
}; } |
6. Save the file.
Step 5: Add JavaScript Code to Display the Lap Time Data on the Web Page
With the code to query for the lap time data complete, we can now focus on rendering the data in the user interface.
1. Open racing.main.js and review the code.
There are a number of ToDo placeholders where you will add code.
2. Set the
variables with your location Id and country code.
The location Id will be a numeric value for your location, e.g. 123, you
will find it at the top of the GAB Racing Lab website. Note that this is
different from the 9 letter Lab Key that you use to access the website and the
game. The country code will be a two letter code for your country, e.g. US, UK,
SE, FR. Your organizer should have made these
available to the attendees at your location, please ask them if they have not
done so.
|
// ToDo: Set your country code and location ID. var yourLocationId = 'YOUR_LOCATION_ID'; var yourCountryCode = 'YOUR_COUNTRY_ID';
// Initialize the page with location statistics initLocationStats(yourLocationId); initCountryStats(yourCountryCode);
}(window.racing)); |
3.
Add the highlighted code to get the track data and pass it to the render
method. Feel free to copy-paste this code, as the method parameters and
property names need to be unique.
This code will use the track object in the racing.data.js file to query for
the data for a specified location and track. To improve performance, the query
will specify only the fields that are required to be rendered in the table. The
code will then call the renderRankingLapTimes method to render the data in the
specified table.
|
// Get the track data and pass it to the render method function initLocationStat(track, selector, locationId) {
// ToDo: Add code to get the track data and pass it to the render method track.getRankingLapTimesByLocation(function (data) { renderRankingLapTimes(data, '.track-stats-location ' + selector, track, 'Location'); }, ['PartitionKey', 'PlayerName', 'LapTimeMs', 'Damage', 'LapId'], locationId); } |
4.
Add the highlighted code to initialize the data for the beginner track.
This code will call the method you just implemented to query and render the
lap time data for the beginner track.
|
// Initialize the data for the tracks. function initLocationStats(locationId) {
// ToDo: Add code to initialize the location data for the beginner track initLocationStat(racing.data.beginnerTrack, '.track-stats-beginner', locationId);
// ToDo: Add code to initialize the location data for the advanced and expert tracks
} |
5. Save the File
Task 2: Test the Website and Deploy it to The Cloud
With the code implemented, it’s time to test the implementation before deploying to the cloud.
Step 1: Test the Implementation Locally
Press F5 to debug the website in your browser. You will hopefully see the top lap times for your location displayed in a table, which should look similar to the screenshot shown below. If you don’t see any lap times, or the code throws an error, move to the optional troubleshooting step. If all is good, you can move to Step 2 and deploy the site to Azure.
Optional Step: Troubleshoot the Implementation
Run through the following steps to troubleshoot the application.
· The page displays OK, but no lap time data is shown
o Has anyone at your location completed a lap on the easy track? If not, play a few laps to create some data.
Step 2: Deploy the Latest Version of the Website to Azure
If you have already created a Web App in Azure and deployed you can easily deploy the latest version of the site.
1. Right-click the web project and click Publish.
The website should deploy to Azure and open in a new browser.
Step 3: Tweet about your Lap Times Website
Now that the results from your location are available in Azure, you can share the site using Social media.
Tweet a link to your site using the #globalazure hashtag!
Exercise 3: Add Lap Time Data for the Other Two Tracks
With the lap time data for the beginner lap created it’s not a lot of work to add two more tables for the times from the advanced and expert laps.
Task 1: Implement the HTML and JavaScript code
1. Open index.html and add the highlighted HTML code under
the Beginner Lap HTML and inside the <div
class="track-stats-location row"> section.
Ensure that the HTML for the other two tables is in the correct place.
|
<div class="container-fluid">
<!-- Todo: Add HTML code for the location lap tables --> <h1 class="title">Top Lap Times for YOUR_LOCATION</h1> <div class="track-stats-location row"> <div class="col-md-4"> <div class="panel panel-warning"> <div class="panel-heading">Beginner lap</div> <table class="track-stats-beginner table table-striped table-hover"></table> </div> </div> <div class="col-md-4"> <div class="panel panel-warning"> <div class="panel-heading">Advanced lap</div> <table class="track-stats-advanced table table-striped table-hover"></table> </div> </div> <div class="col-md-4"> <div class="panel panel-warning"> <div class="panel-heading">Expert lap</div> <table class="track-stats-expert table table-striped table-hover"></table> </div> </div> </div>
<!-- Todo: Add HTML code for the country lap tables -->
<!-- Todo: Add HTML code for the telemetry graphs. -->
</div> |
2. Open racing.main.js and add code to display the data for the other two tracks in the game.
|
// Initialize the data for the tracks. function initLocationStats(locationId) {
// ToDo: Add code to initialize the data for the beginner track initLocationStat(racing.data.beginnerTrack, '.track-stats-beginner', locationId);
// ToDo: Add code to initialize the data for the advanced and expert tracks initLocationStat(racing.data.advancedTrack, '.track-stats-advanced', locationId); initLocationStat(racing.data.expertTrack, '.track-stats-expert', locationId); } |
Task 2: Test and Deploy the Website
Hit F5 to fire up the site in the debugger, and verify that the other two lap time tables are displayed. If you don’t see any lap times, take a short break from coding, and drive a lap on each track to set some times. Remember to brake for the corners, and make efficient use of ERS!
When the website is running OK locally, right-click on the project, and select Publish to deploy the site to Azure.
Task 3: Promote your Website with Twitter
Now that the results from your location are available for all three tracks, you can share the site again using Social media.
Tweet a link to your site using the #globalazure hashtag!
Exercise 4: Add Graphs for Telemetry Data
Racing drivers like to look at their telemetry data, but they really love to look at the telemetry data of drivers who are faster then them.

In this exercise a telemetry graph will be added to the site to show the driver input and the speed and damage of the car. This will help players to improve their driving style by comparing it with others.
Task 1: Add the HTML Code
The first task is to add the HTML placeholder for the graph control. The lab uses the dygraph graph control to display the telemetry data.
1. Open index.html and near the bottom of the file, add a reference to the dyngraph JavaScript file.
|
<!-- Todo: Add HTML code for the telemetry graphs. -->
</div>
<!-- References to JavaScript files --> <script src="https://cdnjs.cloudflare.com/ajax/libs/dygraph/1.1.0/dygraph-combined.js"></script> <script src="racing.data.js"></script> <script src="racing.main.js"></script>
</body> </html> |
2. A little above that, add the HTML code to display the telemetry graph.
|
<!-- Todo: Add HTML code for the telemetry graphs. --> <div id="TelemtryGraphWrapper" style="display: none;"> <h1>Telemetry</h1> <div class="panel panel-success"> <div class="panel-heading title"></div> <div class="panel-body"> <div class="graph"></div> </div> </div> </div>
</div>
<!-- References to JavaScript files --> <script src="https://cdnjs.cloudflare.com/ajax/libs/dygraph/1.1.0/dygraph-combined.js"></script> <script src="racing.data.js"></script> <script src="racing.main.js"></script>
</body> </html> |
Task 2: Add the JavaScript Code
The JavaScript can now be added. Much of the implementation is already present in the starter files.
1. Open racing.data.js and locate the getTrack function.
2. Add the highlighted code to query Table Storage for the Telemetry data.
|
// Creates an object for retrieving data for a specified track. function getTrack(track) { return {
// ToDo: Add code to get data for the specific location getRankingLapTimesByLocation: function (successCallback, fields, locationId) { var filter = getPartitionFilter(locationId); getTableStorageData(auths.tracks[track].rankingLapTimesLocationTrack, successCallback, fields, filter); },
// ToDo: Add code to get data for the specific country getRankingLapTimesByCountry: function (successCallback, fields, countryCode) { var filter = getPartitionFilter(countryCode); getTableStorageData(auths.tracks[track].rankingLapTimesCountryTrack, successCallback, fields, filter); },
// ToDo: Add code to get the telemetry data for a specific lap getTelemetryData: function (successCallback, fields, lapId) { var filter = getPartitionFilter(lapId); getTableStorageData(auths.tracks[track].telemetryData, successCallback, fields, filter); } }; } |
1. Open racing.main.js and locate the showLapTelemetry function.
2. Add the highlighted code to get the telemetry data and pass it to the render function.
|
function showLapTelemetry(lap, track) {
// ToDo: Add code to retrieve the telemetry data from storage and render a telemetry graph track.getTelemetryData(function (data) { var title = lap.PartitionKey + ' by ' + lap.PlayerName; renderLapTelemetry(title, data); }, ['GameTime', 'Speed', 'ErsBatteryPercent', 'Damage', 'SteeringAngle', 'ThrottlePercent', 'BrakesPercent', 'HasUsedErs', 'Gear'], lap.LapId);
} |
3. Save all the files.
Task 3: Test and Deploy the Application
Hit F5 to test the website locally, and when you are satisfied, publish it to Azure.
Optional Exercise: Add Lap Time Data for Your Country
If there is more than one GAB location in your country you can add lap time data for your country to see how well your location is competing with the other locations in your country.
Task 1: Implement the HTML and JavaScript Code
As a lot of the data access code has already been written, it will not take much time to add the code to show the lap time data for your country. This will allow you to compete with players in the other regions in your country for the fastest national time.
Step 1: Add HTML Code to Render the Country Lap Times
The first step is to add the user interface code.
1. In Visual
Studio, open index.html and locate the HTML
code for the three location lap tables.
2. Copy the HTML
code for the three location tables, and paste a copy of it below the ToDo comment
for the country lap tables.
3. Modify the two highlighted lines so that the HTML code can be used to render the country tables.
Step 2: Add JavaScript code to retrieve the Lap Times for your Country
The code can now be added to the JavaScript files to retrieve the country lap data.
1. Open racing.data.js and locate the getTrack(track) function.
2. Add the highlighted JavaScript code to get the data for the specified country.
|
// Creates an object for retrieving data for a specified track. function getTrack(track) { return {
// ToDo: Add code to get data for the specific location getRankingLapTimesByLocation: function (successCallback, fields, locationId) { var filter = getPartitionFilter(locationId); getTableStorageData(auths.tracks[track].rankingLapTimesLocationTrack, successCallback, fields, filter); },
// ToDo: Add code to get data for the specific country getRankingLapTimesByCountry: function (successCallback, fields, countryCode) { var filter = getPartitionFilter(countryCode); getTableStorageData(auths.tracks[track].rankingLapTimesCountryTrack, successCallback, fields, filter); },
// ToDo: Add code to get the telemetry data for a specific lap
}; } |
Step 3: Add JavaScript code to render the Lap Times for your Country
The county lap data can now be bound to the user interface code.
1. Open racing.main.js and scroll to the bottom of the
file.
2. In the initCountryStat method, add the highlighted JavaScript code to get the country track data and pass it to the render method.
|
// Country Statistics function initCountryStat(track, selector, countryCode) { // ToDo: Add code to get the country track data and pass it to the render method track.getRankingLapTimesByCountry(function (data) { renderRankingLapTimes(data, '.track-stats-country ' + selector, track, 'Country'); }, ['PartitionKey', 'PlayerName', 'Location', 'LapTimeMs', 'Damage', 'LapId'], countryCode); } |
3. A In the initCountryStats method, add the highlighted code to initialize the lap time data for your country for all three tracks.
|
function initCountryStats(countryCode) { // ToDo: Add code to initialize the country data for the three tracks initCountryStat(racing.data.beginnerTrack, '.track-stats-beginner', countryCode); initCountryStat(racing.data.advancedTrack, '.track-stats-advanced', countryCode); initCountryStat(racing.data.expertTrack, '.track-stats-expert', countryCode); } |
4. Save all the changes.
Task 2: Test and Deploy the Application
Press F5 to test the application in Visual Studio to ensure that it displays the correct country data. If you don’t see any data from other locations in your country, feel free to challenge them to compete with you.
Once the website is working, deploy it to Azure.
Challenge Exercises
Congratulations, you have completed the lab steps and got a website deployed to Azure!
If you would like to extend the functionality of your website there are a number of challenges that you can work though. In these exercises there are no seep-by-step instructions, so it’s up to you to implement the functionality as you wish.
Don’t forget to share your implementations with other attendees by tweeting a link to them using the #GlobalAzure hashtag. You can also follow that hashtag to see what others have created.
Code Cadet Challenge
Customize the Design of the Website
If you are a talented front-end developer with great graphic and design skills, you may want to invest some time customizing the website to make it stand out from the websites deployed by the other attendees around the world. Feel free to be crazy and creative, and please tweet your design so others can admire it.
If you are a back-end developer, you may wish to skip to the next challenge.
Code Master Challenges
If you have a good understanding of HTML5 and JavaScript and like a challenge, there are some very cool additions to the site that you can make.
Add Pages for Achievements
The achievements table contains the following data:
|
// PartitionKey - CountryCode // RowKey - Achievement
string Description { get; set; } int Points { get; set; }
string Country { get; set; }
bool Bronze { get; set; } bool Silver { get; set; } bool Gold { get; set; }
string BronzeDriver { get; set; } string SilverDriver { get; set; } string GoldDriver { get; set; }
string BronzeLocation { get; set; } string SilverLocation { get; set; } string GoldLocation { get; set; } |
Create a page that lists the achievements for your country.
The racing.main.data.js file contains the table name and SAS key, you will need to add JavaScript code to retrieve the data and HTML code to render the data.
Animated Driver Tracker for the Top Lap Times
Driver trackers show the position of the cars on track in real-time, an example can be seen here. The telemetry data for the players includes the game time in milliseconds, and the positions of the cars on the track, and is typically sampled every 100 milliseconds. The challenge in this exercise is to use a JavaScript graphics library to create a deriver tracker for the top laps driven in your location and country.
Here are some tips to get you started.
· You will need to query Table Storage for the top lap times for your location or country.
· When you have the lap times, you can then query for the telemetry data for the top laps, you may want to try starting out with the top two or three laps at first.
· To get the best performance, query the telemetry table for GameTime, PositionX and PositionY.
· The tracks have the following boundries for X and Y position, this will help you to scale them to the screen resolution.
· You can start off by drawing lines in different colors for the cars using the telemetry data, and get the camera set up to cover the complete lap.
· Once you have the scene set up, you can think about animating the lines using a timer. For each frame you can use the elapsed time in milliseconds to determine how many of the telemetry points should be drawn for each line.
· With the lines now animated, you can also add text to the animation to show the player names for the drivers.
The telemetry data tables contain the following data:
|
// PartitionKey - LapId // RowKey - LapTimeMs
string PlayerName { get; set; } int Level { get; set; } int CarType { get; set; }
int GameTime { get; set; } int TrackSegmentNumber { get; set; } double TrackSegmentPercent { get; set; } int FramesPerSecond { get; set; }
double PositionX { get; set; } double PositionY { get; set; } double PositionZ { get; set; }
double DirectionX { get; set; } double DirectionY { get; set; } double DirectionZ { get; set; }
double UpX { get; set; } double UpY { get; set; } double UpZ { get; set; }
// Driver Input double SteeringAngle { get; set; } int Gear { get; set; } double ThrottlePercent { get; set; } double BrakesPercent { get; set; } bool HasUsedErs { get; set; } double ErsBatteryPercent { get; set; }
// Car physics double Speed { get; set; } int Damage { get; set; } double Acceleration { get; set; } |
Use GameTime for the time into the lap, its in milliseconds, and use PositionX and PositionY for the 2D coordintes. The game world is 0 – 2500 in both the X and Y coordinates.
If you complete the exercise, tweet a link to the page #globalazure.
Code Ninja Challenge
In the world of developers there are always one or two code ninjas, who’s skills at the keyboard vastly outshine that of their peers. Gain respect on a global scale by completing the GAB Racing Lab Code Ninja Challenge…
3D Animation of the Car Positions for the Top Lap Times
This will take some time, quite a bit of expertise, and a dash of creativity, but will bring much respect on a global scale for your Bootcamp location.
There are a number of 3D libraries out there, three.js is one of the popular ones. With a modern browser it enables you to create some very cool 3D effects like this. The challenge of this excercise is to create a web page that will animate the car positions for the fastest laps in real-time and in 3D.
Here are some tips to get you started.
· The three.js homepage is here. If you would like to use this library, go for it, if you have experience with another JavaScript 3D library you are welcome to use that.
· You can use this tutorial to get a basic scene up and running in a new HTML page in the application.
· You will need to query Table Storage for the top lap times for your location or country.
· When you have the lap times, you can then query for the telemetry data for the top laps, you may want to try starting out with the top two or three laps at first.
· To get the best performance, query the telemetry table for GameTime, PositionX, PositionY and PositionZ.
· You can start off by drawing lines in different colors for the cars using the telemetry data, and get the camera set up to cover the complete lap.
· Once you have the scene set up, you can think about animating the lines using a timer. For each frame you can use the elapsed time in milliseconds to determine how many of the telemetry points should be drawn for each line.
If you get this working, please tweet the link at #GlobalAzure. You are a hero!